


EFM32TG11B320F128IM64
仕様
読み込み中…
類似モデルの検索
主要仕様
|
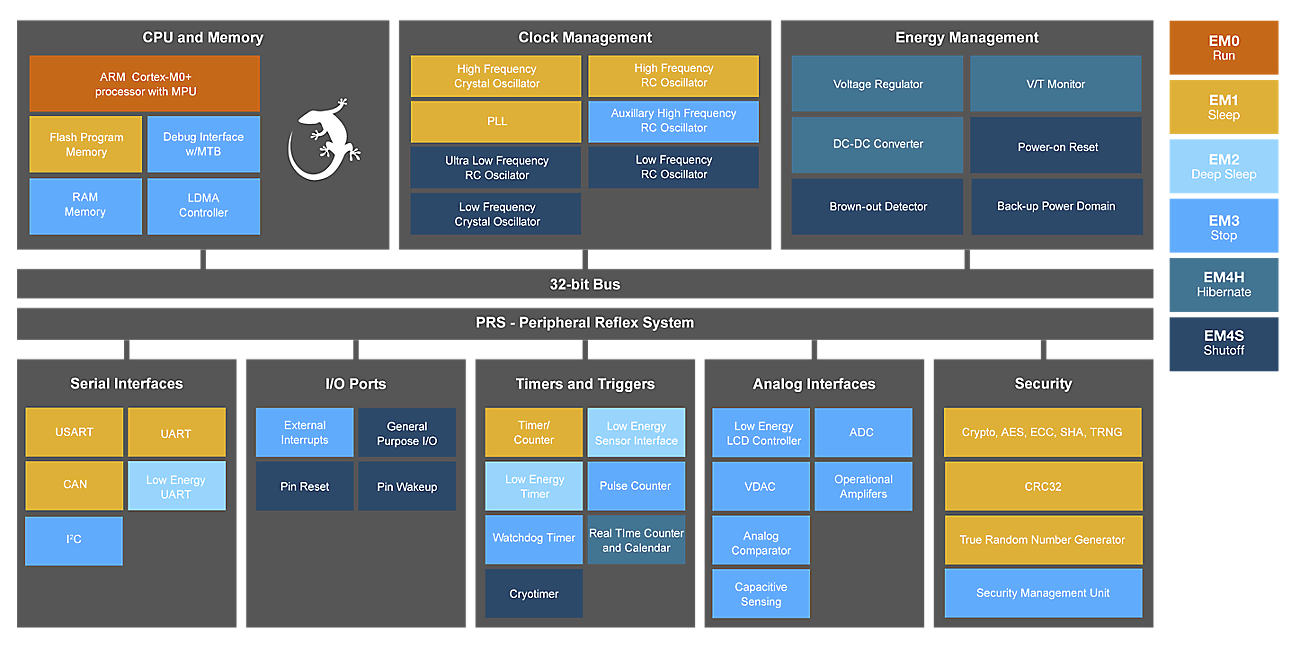
コア周波数
48
|
フラッシュ
128
|
|
|
RAM
32
|
GPIO
56
|
|
|
ADC
12 ビット、 44 チャンネル、1 Msps
|
DAC
2x 12 ビット、 2 チャンネル
|
|
|
SPI
4
|
UART
1
|
|
|
I2C
2
|
タイマ(16 ビット)
2
|
|
|
タイマ(32ビット)
2
|
パッケージ
QFN64
|
|
|
コア周波数
48
|
|
フラッシュ
128
|
|
RAM
32
|
|
GPIO
56
|
|
ADC
12 ビット、 44 チャンネル、1 Msps
|
|
DAC
2x 12 ビット、 2 チャンネル
|
|
SPI
4
|
|
UART
1
|
|
I2C
2
|
|
タイマ(16 ビット)
2
|
|
タイマ(32ビット)
2
|
|
パッケージ
QFN64
|
おすすめセクション
技術文書
ソフトウェアとツール
品質と包装
品質保証、環境および包装に関する情報
Silicon Labs targets a minimum of a 10-year lifecycle for all of its standard products and expects to continue full production of the EFM32TG11B320F128IM64 until at least 3 月 20 日29. この日付以降に EOL を発表する可能性があります。
上記の耐用年数は、この部品番号の優先改訂用です。部品番号改訂の完全リストについては、下の検索ボタンを使用してください。
供給継続のための継続的なコミットメントの一環として、サプライチェーンの調整、製品の改善、市場の状況、または同様のビジネス業務上や技術的な問題により、Silicon Labs が必要であると判断した場合、Silicon Labs はピンと互換性があり、機能的に同等の代替製品を提供することがあります。
ビジネス、技術またはその他の理由で Silicon Labs が妥当とする采配を超えた場合、Silicon Labs は、製品を製造中止する必要があると判断し、通知から 6 か月で最後の注文をおこない、通知から 12 か月で最後の出荷をおこなう旨を伝える EOL 通知を発行することをポリシーとしています。本ポリシーは、半導体業界で一般的に使用されている JEDEC 規格 EIA/JESD48 に準拠しています。製品のライフサイクルに必要なサポートを提供します。

Silicon Labsのデバイスの品質、環境、デバイスの構成、テスト結果、出荷、サプライチェーンに関する追加情報を検索し、ダウンロードすることができます。
検索結果には以下が含まれます。
- 製品情報
- 梱包情報
- 品質システム認証
- 財務情報
- 紛争鉱物(CMRT)
- 環境情報
- RoHS 準拠証明書
- REACH 宣言
- 詳細なデバイス構成 (MDDS)
- MCD/FMD
- RoHS 準拠証明書
- 認定データ
- 貿易コンプライアンス:ECC/HTS コード
- サプライチェーン情報
- IPC 1752-2 クラス6 (XML 形式)
- ICP テスト・レポート
- ハロゲンフリー準拠証明書
- PFOS 準拠証明書
- 供給保証書 (長期)
コミュニティとサポート
